lens chart to detect redundancies and gaps
p.1 #1lens chart to detect redundancies and gaps
after 6 years of hobby use of photography, thought of plotting my inventory of lenses to detect overlaps and uncovered ranges.
I might have over-done my GAS. just a tiny bit

I might have over-done my GAS. just a tiny bit
Aug 10, 2026 at 07:56 PM
p.1 #2lens chart to detect redundancies and gaps
I'd sort by the equivalent FL so the MFT and FX are more logically organized.
Why no Sony E or Fuji GFX? I think you should collect some of those next.
IQ is at a whole other level than Nikon/Canon stuck at 45MP.
EBH
Why no Sony E or Fuji GFX? I think you should collect some of those next.
IQ is at a whole other level than Nikon/Canon stuck at 45MP.
EBH
Aug 10, 2026 at 09:11 PM
p.1 #3lens chart to detect redundancies and gaps
EB-1 wrote:
I'd sort by the equivalent FL so the MFT and FX are more logically organized.
Why no Sony E or Fuji GFX? I think you should collect some of those next.
IQ is at a whole other level than Nikon/Canon stuck at 45MP.
EBH
thanks. on the first, not sure I follow, all MFT lenses are plotted in FF equivalent. or at least I thought I asked gemini to do that when creating the chart. I will take another look.
painfully, I had to sell my GFX lenses. I was not using them enough to justify and then I "discovered" how great the Fringer adapter works with many Nikon F mount lenses, so I keep my GFX 100s II happy that way.
next, I want to try fuji X, as I can use adapter.
I'd sort by the equivalent FL so the MFT and FX are more logically organized.
Why no Sony E or Fuji GFX? I think you should collect some of those next.
IQ is at a whole other level than Nikon/Canon stuck at 45MP.
EBH
thanks. on the first, not sure I follow, all MFT lenses are plotted in FF equivalent. or at least I thought I asked gemini to do that when creating the chart. I will take another look.
painfully, I had to sell my GFX lenses. I was not using them enough to justify and then I "discovered" how great the Fringer adapter works with many Nikon F mount lenses, so I keep my GFX 100s II happy that way.
next, I want to try fuji X, as I can use adapter.
Aug 11, 2026 at 12:12 AM
p.1 #4lens chart to detect redundancies and gaps
Your chart does have MFT lenses plotted as FF. And as an engineer and gasaholic I like it!
Only comment is that I think the 2 systems should be plotted separately (ie MFT and FF). To my way of thinking if I'm heading out the door with one system I need to know it's lens gaps depending on my plans for the day (unless you take both systems every day).
Mike
Only comment is that I think the 2 systems should be plotted separately (ie MFT and FF). To my way of thinking if I'm heading out the door with one system I need to know it's lens gaps depending on my plans for the day (unless you take both systems every day).
Mike
Aug 11, 2026 at 04:00 AM
p.1 #5lens chart to detect redundancies and gaps
Just as I was thinking about culling drastically myself. I tell myself I have all this gear for different occasions, but end up taking such a small kit with me whenever I go somewhere that it's kind of silly to keep so much stuff I don't use.
Just a look in one lens drawer overwhelms with redundancy. And I have multiple drawers...
Just a look in one lens drawer overwhelms with redundancy. And I have multiple drawers...
Aug 11, 2026 at 04:23 AM
p.1 #6lens chart to detect redundancies and gaps
You acquired all those lenses in 6 years? Have you actually used them all to the point of understanding their strengths and weaknesses. I personally could not fathom having so many lenses.
Aug 11, 2026 at 07:12 AM
p.1 #7lens chart to detect redundancies and gaps
mcbroomf wrote:
Your chart does have MFT lenses plotted as FF. And as an engineer and gasaholic I like it!
Only comment is that I think the 2 systems should be plotted separately (ie MFT and FF). To my way of thinking if I'm heading out the door with one system I need to know it's lens gaps depending on my plans for the day (unless you take both systems every day).
Mike
Only the primes are sorted by effective FL (angle of view). The zooms are by FL only. The X axis is out of whack. It's obviously not a scatter, but not log either. Maybe it is by every nth lens, but that's not a good way. I'd want to see the Excel file or whatever.
The main takeaway I see is that the OP has an excessive amount of primes. What we don't see is what lenses are used how often and what percentage of keepers are from what lenses.
EBH
Your chart does have MFT lenses plotted as FF. And as an engineer and gasaholic I like it!
Only comment is that I think the 2 systems should be plotted separately (ie MFT and FF). To my way of thinking if I'm heading out the door with one system I need to know it's lens gaps depending on my plans for the day (unless you take both systems every day).
Mike
Only the primes are sorted by effective FL (angle of view). The zooms are by FL only. The X axis is out of whack. It's obviously not a scatter, but not log either. Maybe it is by every nth lens, but that's not a good way. I'd want to see the Excel file or whatever.
The main takeaway I see is that the OP has an excessive amount of primes. What we don't see is what lenses are used how often and what percentage of keepers are from what lenses.
EBH
Aug 11, 2026 at 08:13 AM
p.1 #8lens chart to detect redundancies and gaps
EB-1 wrote:
Only comment is that I think the 2 systems should be plotted separately (ie MFT and FF). To my way of thinking if I'm heading out the door with one system I need to know it's lens gaps depending on my plans for the day (unless you take both systems every day).
MikeOnly the primes are sorted by effective FL (angle of view). The zooms are by FL only. The X axis is out of whack. It's obviously not a scatter, but not log either. Maybe it is by every nth lens, but that's not a good way. I'd want to see the Excel file or whatever.
The main takeaway I see is that the OP has an excessive amount of primes. What we don't see is what lenses are used how often and what percentage of keepers are from what lenses.
EBH
Maybe the OP changed it but the Zooms are plotted as FF values. The X scale is Log Base 2
mcbroomf wrote
Your chart does have MFT lenses plotted as FF. And as an engineer and gasaholic I like it!Only comment is that I think the 2 systems should be plotted separately (ie MFT and FF). To my way of thinking if I'm heading out the door with one system I need to know it's lens gaps depending on my plans for the day (unless you take both systems every day).
Mike
The main takeaway I see is that the OP has an excessive amount of primes. What we don't see is what lenses are used how often and what percentage of keepers are from what lenses.
EBH
Maybe the OP changed it but the Zooms are plotted as FF values. The X scale is Log Base 2
Aug 11, 2026 at 08:49 AM
|
p.1 #9lens chart to detect redundancies and gaps
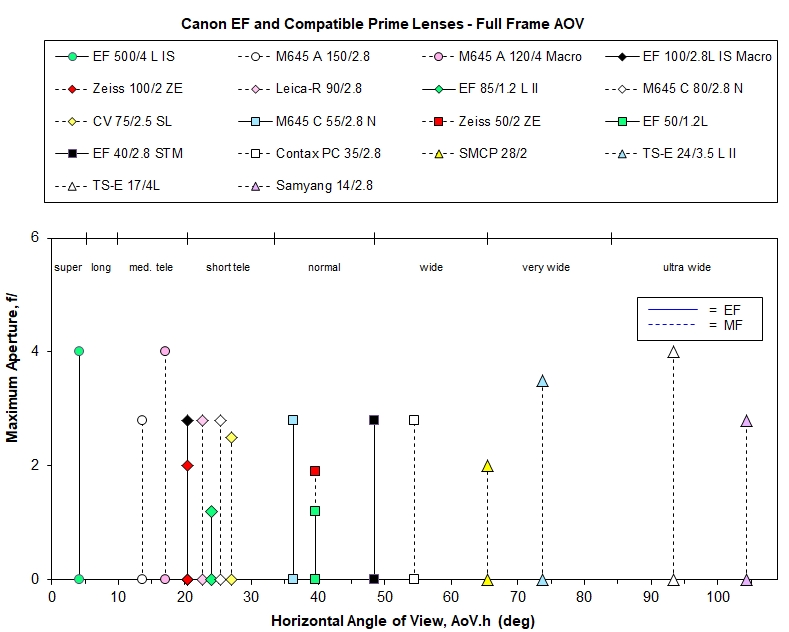
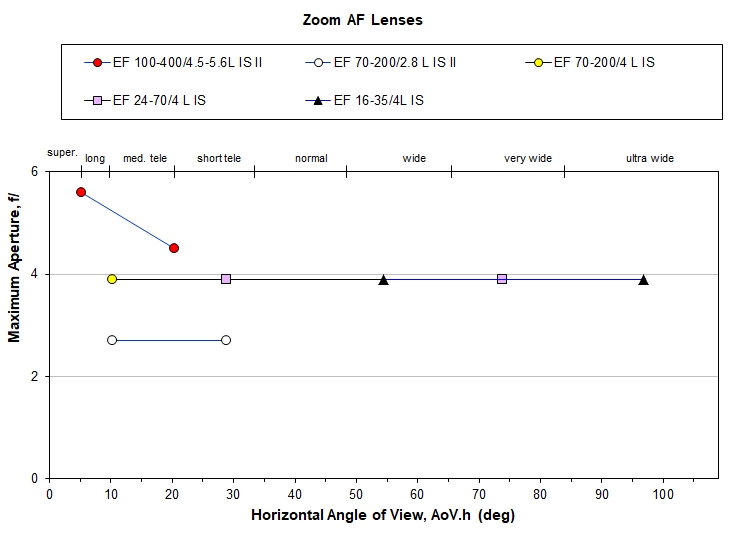
I plot my lenses in a way to show gaps and to make easy comparison of lens speed (aperture). The first example below shows most of my prime "shooters", and the second shows a much less dense plot for my EOS zoom lenses.
I consider lens resolution separately; if it's not up to my expectations, I don't keep it. This doesn't mean that all of my lenses have excellent resolution, or MTF scores (but most do), that would rule out most 'soft' lenses. I even use an old generic 35mm M42 lens that's missing its front element - it has awesome distortion (and it's pretty sharp in the middle).
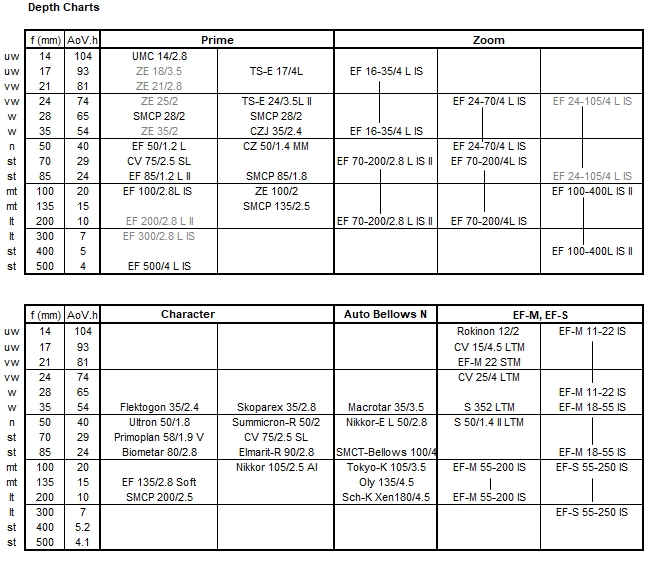
I also use text-based 'depth charts' (third example below), and a variety of special plots for stitched-panoramas, tilt-shift, macro, etc.
P.S. the greyed-out lenses in the Depth Chart are ones that I sold in the last few years. I don't want to forget about them, in case I need to get them back.
I consider lens resolution separately; if it's not up to my expectations, I don't keep it. This doesn't mean that all of my lenses have excellent resolution, or MTF scores (but most do), that would rule out most 'soft' lenses. I even use an old generic 35mm M42 lens that's missing its front element - it has awesome distortion (and it's pretty sharp in the middle).
I also use text-based 'depth charts' (third example below), and a variety of special plots for stitched-panoramas, tilt-shift, macro, etc.
P.S. the greyed-out lenses in the Depth Chart are ones that I sold in the last few years. I don't want to forget about them, in case I need to get them back.
Aug 11, 2026 at 01:38 PM
p.1 #10lens chart to detect redundancies and gaps
I've had my share of GAS over the years, but after shooting many motorsports events, my workhorse lenses are the somewhat boring trio of Nikon 24-120/4 G VR, 70-200/2.8 E VR and 200-500/5.6 E VR. I wouldn't know where to begin with making charts like these.
Aug 13, 2026 at 10:55 PM
p.1 #11lens chart to detect redundancies and gaps
scoundrel wrote:
I've had my share of GAS over the years, but after shooting many motorsports events, my workhorse lenses are the somewhat boring trio of Nikon 24-120/4 G VR, 70-200/2.8 E VR and 200-500/5.6 E VR. I wouldn't know where to begin with making charts like these.
I've taken the perhaps more radical and outlandish approach of shooting with my lenses and using that experience to identify potential gaps in the lineup. A chart might tell me I have a gap between X and Y mm focal length but does it actually matter to me?
I've had my share of GAS over the years, but after shooting many motorsports events, my workhorse lenses are the somewhat boring trio of Nikon 24-120/4 G VR, 70-200/2.8 E VR and 200-500/5.6 E VR. I wouldn't know where to begin with making charts like these.
I've taken the perhaps more radical and outlandish approach of shooting with my lenses and using that experience to identify potential gaps in the lineup. A chart might tell me I have a gap between X and Y mm focal length but does it actually matter to me?
Aug 16, 2026 at 06:20 AM
p.1 #12lens chart to detect redundancies and gaps
Simply comparing focal lengths you own doesn't really tell you much. How frequently do you actually use a particular focal length and/or aperture? There are several good tools for analyzing usage based on EXIF data in your photo catalog.
This is a plug-in for Adobe LrC: https://regex.info/blog/lightroom-goodies/data-plot
This is a plug-in for Adobe LrC: https://regex.info/blog/lightroom-goodies/data-plot
Aug 16, 2026 at 01:41 PM
p.1 #13lens chart to detect redundancies and gaps
Many of my most-used lenses don't provide EXIF data. I gave up on chipped-adapters many years ago.
Aug 17, 2026 at 09:18 AM
p.1 #14lens chart to detect redundancies and gaps
I don't see a 43mm on their. Maybe you should buy a Pentax body so you can run the HD PENTAX-FA 43mm F1.9 Limited
Sep 09, 2026 at 12:43 PM
p.1 #15lens chart to detect redundancies and gaps
tempting tempting indeed.
Sep 09, 2026 at 01:03 PM